Working with Pivot Tables
Purpose
Sorting a Pivot Table
In RCM Analytics, Pivot Table can be sorted by its corresponding column values, data values and summary values.
Expand/Collapse Option
Expand/Collapse in a Pivot View is a handy feature that provides additional flexibility to the users. This option allows you to further drill-down your Pivot table.
Using this option, a Pivot table user or a viewer can further explore and understand the data in a Pivot View. This feature works in a hierarchical manner. i.e., the users can view the higher group and gradually move to the groups within or do the reverse.
Using Expand/Collapse (+/-) Option
This option will be enabled by default. You can choose to display the expand or collapse (+/-) icons in a Pivot View using the Expand/Collapse option available under the Layout Settings.
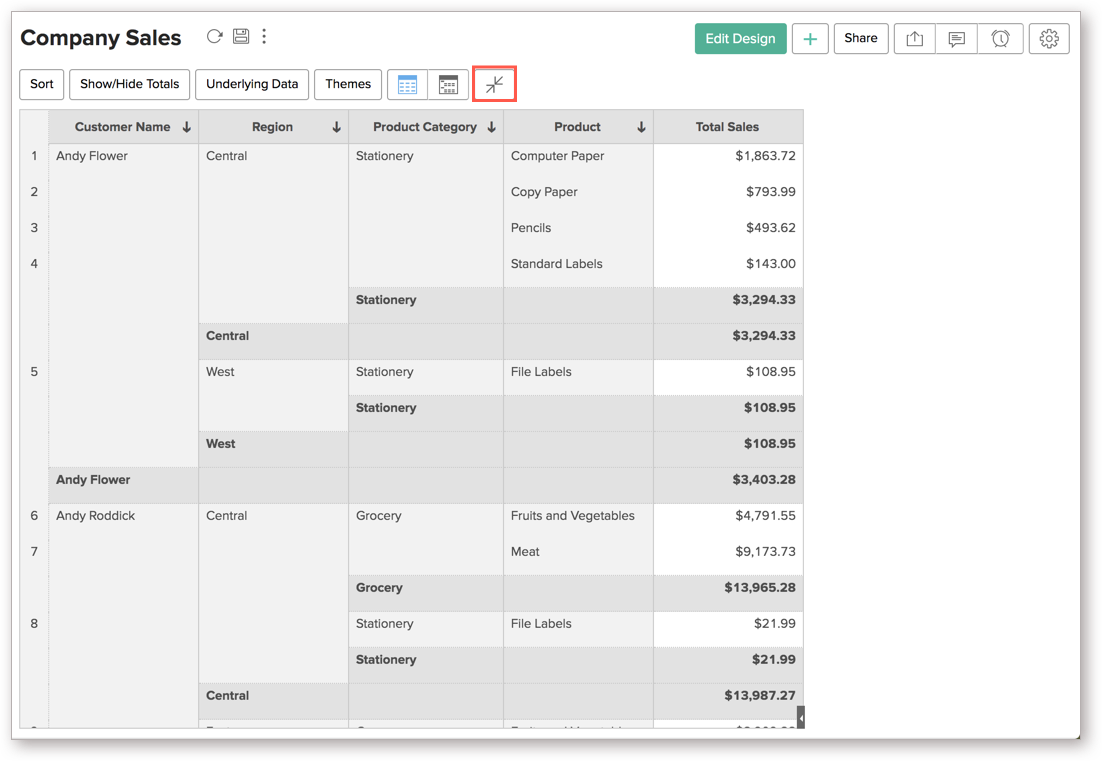
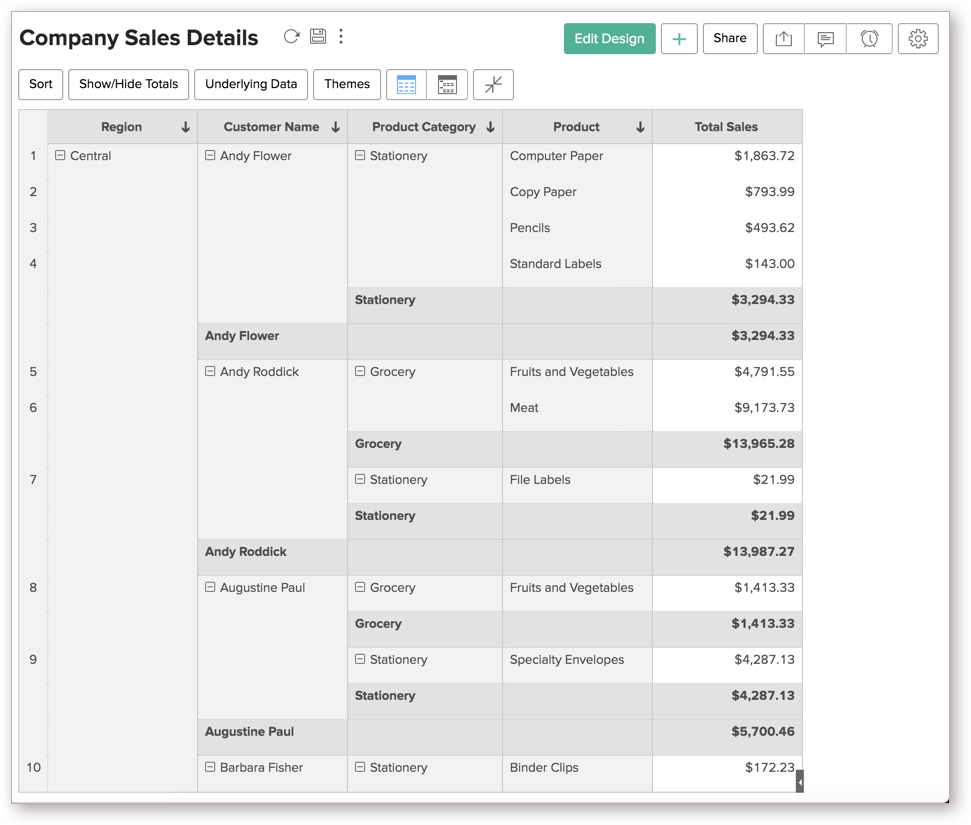
You can expand and collapse rows in a multiple-rows Pivot View by clicking the Expand/Collapse icon available in the toolbar or by right-clicking a specific cell in the Pivot table. The (+/-) icons will be displayed on the left side of a row heading in the pivot.
The Expand/Collapse option in the toolbar is for the entire Pivot. When you click this option, your entire Pivot will be in either Expand mode or Collapse mode.

Pivot View in Expand Mode:
Pivot View in Collapse Mode:
Apart from the Expand All and Collapse All option, you can also perform the following actions by right-clicking a specific cell:

- Expand/Collapse All: Click this option if you wish to expand/collapse the entire Pivot table. This performs the same function as the Expand/Collapse option in the toolbar.
- Expand/Collapse <cell name>: This option will expand/collapse all the cells available underneath the selected cell.
- Expand/Collapse each <cell name>: This option will expand/collapse all cells with the same cell name in the column.
- Expand/Collapse entire <column name>: This option will expand/collapse the entire column.
Viewing Underlying Data
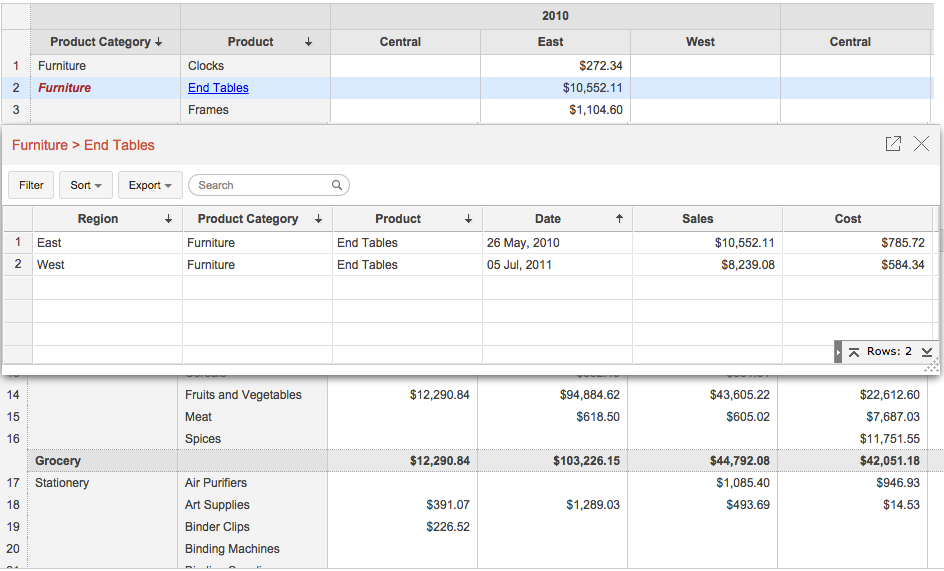
RCM Analytics provides an option to view (drill into) the data that makes up the Pivot Table using the option called View Underlying Data. You can click on any cell in the Pivot Table to view its underlying data in a pop-up table. Clicking your mouse over a cell in the selected Pivot Table will display its underlying data in a pop-up table. You can also view the overall data by clicking the option View Underlying Data in the toolbar.
The following screen-shot describes how underlying sales data will be displayed when you click on the relevant data point in the Pivot Table.

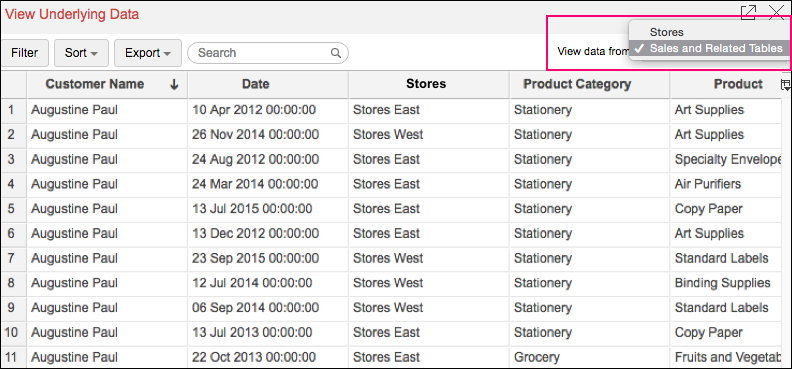
In case you have created a Pivot by joining two or more tables then you can view the underlying data by selecting the tables from the View Data From drop-down. By default, the option displaying the base table along with the related tables will be selected. You can also choose to view the individual tables separately.
The below example shows the View Underlying Data table of a report that was created by joining the Sales table and the Stores table. By default, the option Sales and Related Tables will be selected. This option will display the data from both Sales and Stores in a single table. However, if you wish to view the data only from the Stores table you can do so by selecting Stores from the View Data From drop-down.

The View Underlying Data table that opens provides options to Show/Hide columns, search, filter and sort the data displayed. You can also export the underlying data into a variety of file formats like CSV, XLS, PDF and HTML.
Exporting a Pivot Table
RCM Analytics allows you to export Pivot table that you have created into various file formats like CSV, PDF, XLS and HTML.
To export a Pivot Table:
- Open the Pivot Table that you would like to export
- Select Export button in the toolbar
- Select one of the five export format options:
- CSV - Exports the underlying data of the Pivot Table as a Comma Separated Value (CSV) file.
- Excel (XLS) - Exports the underlying data of the Pivot Table as a Excel file.
- PDF - Exports the Pivot Table in Portable Document Format (PDF) file format.
- HTML - Exports the Pivot Table in HTML file format.
- In the export settings window that opens, set the required options and then click Export button at the bottom to export.

Important Articles
- Whats New in RCM
- Getting Started with RCM
- Standard RCM Procedures
- Card Vault Deprecation 2025 – Frequently Asked Questions
Related Articles
Creating a New Pivot Table
Purpose A Pivot Table allows you to dynamically summarize large amounts of data for easy analysis and visualization. You can transform data in a table(s) into meaningful summaries easily by using the intuitive drag and drop interface provided by RCM ...Working with Charts
Purpose RCM Analytics offers a wide range of interactive options on a chart when accessed by an end-user. The options include interactive chart highlighting, changing chart type, dynamic filtering of data displayed, sorting, viewing underlying data, ...Working with the Template Editor
Purpose: The Template editor allows you to create the base for the emails you need to send to your customers when working with your bookings within RCM. The information for the emails is taken directly from these templates along with data entered ...Q: Why isn't two factor authentication working on my iPhone?
A: If two factor authentication isn’t working on your Apple device you may be affected by a known time bug with the latest versions of IOS. To use Rental Car Manager’s two factor authentication with your Apple device you may need turn off the “Set ...Working With Notes
Purpose Notes can be added to a reservation to record any information relevant to the booking. This can include any followup activity required or additional information where a field is not available for entry in the booking form. Subjects can be ...